Relative StrengthRelative Strength Colored
This script plots Relative strength Compared to TSLA Index.
You can change it to your requirement .
在腳本中搜尋"relative strength"

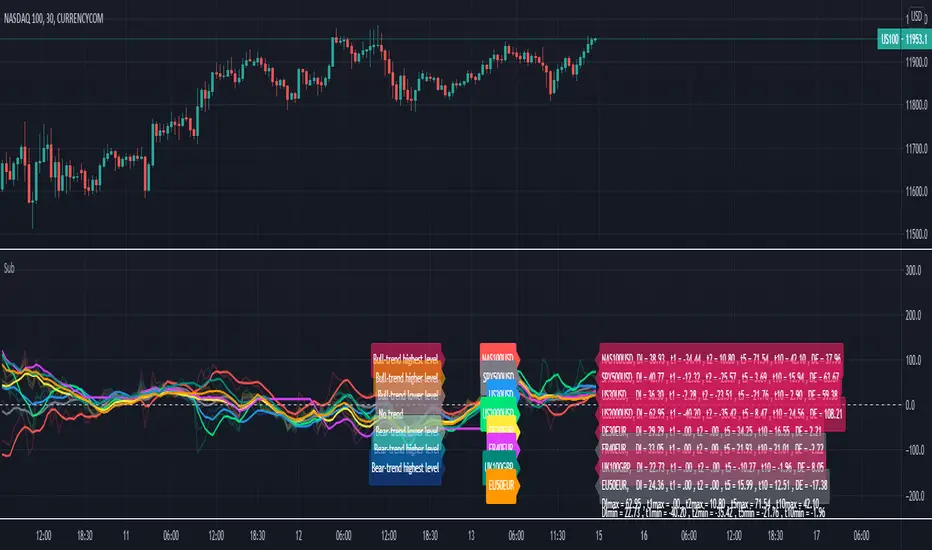
Relative Strength Index of EU and US Stock Index Trends quality//Relative Strength Index of European and US Stock Index Trends quality
//This indicator reveals the relative strength of European and US stock index futures.
//take Bull trend as an example , the current closed price>EMA20 value and the current closed price >20th previous bar closed price( deduction price),
//it's defined as a lower level bull trend .If the current price EMA20>EMA60, it's defined as a higher level bull trend .If the EMA20>EMA60>EMA120,it's defined as the highest level bull trend.
//You can choose to draw the curve with the deviation rate of the original major indexes to 20EMA, or draw the deviation rate with the average value (default value is 5 bars).
//In addition, a more technical method is added to analyze the deviation changes of the major indexes.The deviation rate changing velocity value, parameter tan (abbreviated by t) of 1, 2, 5, 10 is introduced.
//You can have the option of calculate the tan using average value of 5 candlesticks or original value.
//Taking tan1 as an example, it indicates how much the deviation rate between the current price and the previous candlestick has changed.
//The indicator of the index color and the description of the trend quality color can be switched off in option.
//In addition, this code color scheme is only suitable for black background (the code color needs to be changed by yourself if you use white background).

Relative Strength ComparisonRelative Strength Comparison compares a security's price change with that of a "base" security or index.
You can change the "base" security from the indicator settings.
You can compare:
- Stock to other stock
- Stock to the benchmark index
- One index to another index

Relative Strength Index @ inflowjetRelative Strength Index 80/20 with extra 30/70 area and 50% dashed line

Relative Strength RankRelative Strength Rank Indicator
( ( Long Term Price Change + Short Term Price Change ) / 2 ) / 10 Day ATR


Relative Strength IndiaRelative Strength measures the price change with respect to an Index. A rising trend is GREAT. Actual values are not comparable across securities

Relative Strength LineRelative Strength Line compares equity's price performance with S&P 500 (default). The indicator will retrieve current equity value comparing it with S&P 500 equivalent time frame.
S&P 500 is set as the default index for comparison. This value can be change to any equity available in the market, located at the format settings of the indicator.

Relative Strength Index on TranquilizersSome weeks ago, I had a patient in my practice who suffered from internal stability disorders.
Certainly not a case of disordered thinking or schizophrenic behaviour, because his general sense of direction wasn’t the problem.
He just couldn’t find the right overall balance, an ailment he struggled with for years.
Straight away I could diagnose that surgery wasn’t an option, so I gave him a medicine he would clearly benefit from.
I never heard from him again…. He must be doing just fine.
Cheers, Indicat...
Relative Strength Trend Indicator (RSTI)This indicator is called the "Relative Strength Trend Indicator" (RSTI), designed to assess the relative strength of a trend.
Here is a detailed explanation of how it works and how traders can interpret it:
Indicator Operation:
1. Data Source (src): The indicator considers a data source, typically the closing price (close), but this can be adjusted according to the trader's preferences.
2. Period Length (Length): This determines the period used to calculate the simple moving average (SMA) of the data source. A longer period smoothes the indicator, while a shorter period makes it more responsive.
3. Multiplier (Multiplier): This is a multiplication factor applied to the Average True Range (ATR), adjusting the width of the bands.
4. Signal Length (Signal Length): This period is used to calculate the simple moving average of the relative strength (l_strength). It determines the sensitivity of the signal to changes in relative strength.
Interpretation of the Indicator:
1. Upper Strength Band (Upper Level): This line is drawn at 80 and represents a high strength level. When relative strength exceeds this value, it may indicate a potential overbought market.
2. Lower Strength Band (Lower Level): This line is drawn at 20 and represents a low strength level. When relative strength is below this value, it may indicate a potential oversold market.
3. RSTI Strength: The main line of the indicator, representing the calculated relative strength. When this line exceeds 50, it may indicate an uptrend, while a value below 50 may indicate a downtrend.
4. Filling Zones: These colored zones between levels 80 and 50, and between 50 and 20, can help quickly visualize relative strength. A colored zone above 50 indicates positive strength, while a colored zone below 50 indicates negative strength.
Qualities of the Indicator:
1. Adaptability: The use of ATR and the flexibility of parameters (length, multiplier, signal_length) allow the indicator to adapt to different market conditions.
2. Visual Clarity: Colored filling zones and horizontal lines make it easy to visualize relative strength levels.
3. Strength Signal: The signal line (RSTI Strength) allows traders to quickly spot changes in relative strength, facilitating decision-making.
4. Responsiveness: The combination of smoothed moving averages and relative strength indicators allows responsiveness to trend changes while reducing false signals.
It is essential to note that while this indicator can provide valuable insights, it is always recommended to use it in conjunction with other technical analysis tools for informed decision-making.

Relative Strength and MomentumRelative Strength and Momentum Indicator
Unlock deeper market insights with the Relative Strength and Momentum Indicator—a powerful tool designed to help traders and investors identify the strongest stocks and sectors based on relative performance. This custom indicator displays essential information on relative strength and momentum for up to 15 different symbols, compared against a benchmark index, all within a clear and organized table format.
Key Features:
1. Customizable Inputs: Choose up to 15 symbols to compare, along with a benchmark index, allowing you to tailor the indicator to your trading strategy. The 'Lookback Period' input defines how many weeks of data are analyzed for relative strength and momentum.
2. Relative Strength Calculation: For each selected symbol, the indicator calculates the Relative Strength (RS) against the chosen benchmark. This RS is further refined using an exponential moving average (EMA) to smooth the results, providing a more stable trend overview.
3. Momentum Analysis: Momentum is determined by analyzing the rate of change in relative strength. The indicator calculates a momentum rank for each symbol, based on its relative strength’s improvement or deterioration.
4. Percentile Ranking System: Each symbol is assigned a percentile rank (from 1 to 100) based on its relative strength compared to the others. Similarly, momentum rankings are also assigned from 1 to 100, offering a clear understanding of which assets are outperforming or underperforming.
5. Visual Indicators:
a. Green: Signals improving or stable relative strength and momentum.
b. Red: Indicates declining relative strength or momentum.
c. Aqua: Highlights symbols performing well on both relative strength and momentum—ideal candidates for further analysis.
6. Two Clear Tables:
a. Relative Strength Rank Table: Displays weekly rankings of relative strength for each symbol.
b. Momentum Table: Shows momentum trends, helping you identify which symbols are gaining or losing strength.
7. Color-Coded for Easy Analysis: The tables are color-coded to make analysis quick and straightforward. A green color means the symbol is performing well in terms of relative strength or momentum, while red indicates weaker performance. Aqua marks symbols that are excelling in both areas.
Use Case:
a. Sector Comparison: Identify which sectors or indexes are showing both relative strength and momentum to pick high-potential stocks. This allows you to align with broader market trends for improved trade entries.
b. Stock Selection: Quickly compare symbols within the same sector to find the stronger performers.

Relative Strength (Volatility Adjusted)The volatility adjusted relative strength indicator offers a more precise approach to traditional RS indicators by incorporating volatility adjustments into its calculations. This will provide traders with a more nuanced view of relative performance between a selected instrument and a comparison index.
Identifying Relative Strength (RS) and Weakness (RW) against a benchmark like the SPY is crucial for traders, as it highlights institutional activity in an equity, which retail traders rarely achieve on their own. However, the traditional method of simply comparing the rate of change of a stock to the rate of change for the SPY can be flawed. This method often fails to account for the inherent volatility of each stock, leading to misleading RS/RW readings.
Consider two stocks that both move in response to SPY's movements. If SPY moves significantly more than its average (measured by its ATR), and the stock does the same, traditional RS calculations might show strength when, in fact, the stock is just mirroring SPY's increased volatility. For instance, if SPY typically moves $0.25 an hour but suddenly moves $1, and a stock typically moves $0.50 but moves $2, the stock's apparent RS might be overstated, when in reality there is no relative strength for the stock.
By adjusting for volatility using the ATR (Average True Range), we normalize these movements and get a clearer picture of true RS/RW. For example, if SPY moves 5 times its average rate and a stock moves the same multiple of its own ATR, the RS should be considered neutral rather than strong. Similarly if a stock in absolute terms moves $1 while the SPY also moves $1 but the stock usually moves at twice the rate of the SPY, the stock should be considered relatively weak - not neutral.
Usage
Use this to identify stocks with actual strength or weakness compared to the market.
When the RS line is above 0 and above the moving average it indicates a stock with relative strength that is still gaining more strength.
When the RS line is above 0 but above the moving average it indicates a stock with relative strength that is currently losing strength.
When the RS line is below 0 and below the moving average it indicates a stock with relative weakness that is still losing strength.
When the RS line is below 0 but above the moving average it indicates a stock with relative weakness that is starting to gain back some strength.

Relative Strength Overlay [BackQuant]Relative Strength Overlay
Relative Strength Overlay is a new innovative proprietary adaptive calculation to get an assets relative strength. To ensure this is well put together and easy for traders to use we have made it into an overlay. Allowing traders and investors to spot clear trends in both the up and down directions. Providing clear signals, and an option for a gradient to allow users to screen assets with strong relative strength and potentially define a trading period.
Please take the time to read the following.
Importance and Concepts
1. Adaptive Relative Strength Calculation:
At the heart of this indicator lies an adaptive relative strength calculation, a pivotal concept that goes beyond the traditional RSI (Relative Strength Index) by dynamically adjusting its sensitivity based on recent price action. This adaptability ensures that the indicator is more responsive to current market conditions, enhancing its effectiveness in signaling potential reversals or continuations.
2. Volatility and Price Action Adaptivity:
Incorporating an adaptive approach to both volatility and price action, the indicator refines its signals to reflect the current market environment more accurately. This adaptability is achieved through a custom calculation that considers the volatility (using ATR - Average True Range) and price action (through DEMA - Double Exponential Moving Average), ensuring that the indicator remains sensitive to sudden changes in market dynamics.
3. DEMA Utilization:
The use of DEMA provides a price-adaptive mechanism that smoothens the indicator's output, making it more reliable during volatile periods. DEMA helps in reducing the lag associated with traditional moving averages, offering a quicker response to price changes and enhancing the adaptive nature of the relative strength calculation.
Main Features and Trading Applications
Comprehensive UI Settings:
The indicator comes with extensive user interface settings, allowing traders to customize various parameters according to their trading preferences. These settings include adjustment options for calculation periods, standard deviation factors, and the ability to toggle features like volatility bands and signal lines on or off.
Volatility-Adjusted Bands:
Utilizing a custom ATR calculation, the indicator plots volatility bands that adjust according to current market volatility. These bands serve as dynamic support and resistance levels, providing traders with potential entry and exit points based on the confluence of relative strength signals and band breaches.
Calibrated Trading Conditions:
The indicator features pre-modeled long and short conditions that have been backtested to ensure robustness. These conditions help in identifying high-probability trading setups, making the indicator a valuable tool for both discretionary and systematic traders, mainly looking to either define a trading period, or capture clear trends in confluence with other metrics.
Trading Range Identification:
By filtering assets based on their relative strength, traders can use the indicator to identify securities with strong momentum. This feature is particularly useful for portfolio selection and asset screening, allowing traders to focus on the most promising opportunities.
Gradient Background Hue:
The indicator offers a unique visual aid in the form of a gradient background hue, which assists in quickly screening assets based on their relative strength. This color-coding feature aids in identifying potential reversals as it highlights changes in the strength's direction.
Adaptive Volatility Bands with Standard Deviations:
The inclusion of three sets of volatility bands, each corresponding to different standard deviations, provides a probabilistic view of price movements. These bands adapt to current market volatility, offering traders insights into the likelihood of price staying within certain ranges. This goes up to +-3 Standard Deviations.
Alert Conditions and Signal Visualization:
With built-in alert conditions for long and short signals, along with the ability to paint candles according to the prevailing trend, traders can stay informed about significant market movements. This feature enhances the decision-making process by visually representing the strength and direction of the trend.
alertcondition(ta.crossover(BackQuant, 0), title="Positive RS", message="Positive RS {{exchange}}:{{ticker}}")
alertcondition(ta.crossunder(BackQuant, 0), title="Negative RS", message="Negative RS {{exchange}}:{{ticker}}")
Concluding Remarks.
In conclusion our Relative Strength Overlay indicator is a comprehensive tool that leverages adaptive calculations and volatility adjustments to provide traders with nuanced insights into market conditions. By combining traditional concepts with innovative features, this indicator offers a versatile solution for traders seeking to enhance their market analysis and identify high-probability trading opportunities.
Thus following all of the key points here are some sample backtests on the 1D Chart
Disclaimer: Backtests are based off past results, and are not indicative of the future.
INDEX:BTCUSD
INDEX:ETHUSD
BINANCE:SOLUSD
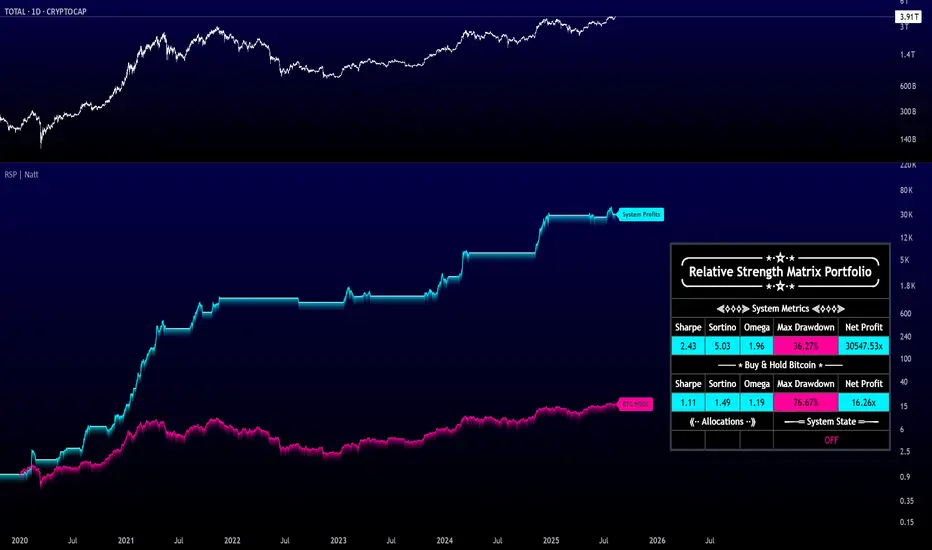
Relative Strength Portfolio [AlphaAlgos]🚀 Relative Strength Matrix Portfolio - Advanced Multi-Asset Rotation Strategy
This institutional-grade portfolio rotation system represents a culmination of sophisticated quantitative research methodologies, delivering a comprehensive approach to systematic crypto-asset selection and portfolio management. Through advanced relative strength analysis and multi-factor filtering, the system identifies optimal trading opportunities while maintaining strict risk management protocols.
The Matrix Foundation
At its core, the system employs an intricate relative strength matrix that evaluates each asset against every other asset in the universe through RSI calculations. This creates a robust scoring framework where assets accumulate points based on their relative performance, generating a detailed picture of market leadership and strength. The matrix calculations account for the complex interrelationships between assets, ensuring a thorough understanding of relative performance.
Multi-Factor Filtering Framework
Beyond the foundational matrix, the system incorporates sophisticated filtering mechanisms that analyze multiple aspects of asset behavior:
Alpha and Beta Analysis examines each asset's performance characteristics relative to the broader market, identifying those that demonstrate superior risk-adjusted returns while maintaining favorable volatility profiles.
The GunzoTrendSniper algorithm provides specialized trend analysis, ensuring selected assets maintain positive directional bias. This combines with momentum calculations that evaluate price action characteristics across multiple timeframes.
Risk-adjusted performance metrics including Sharpe, Sortino, and Omega ratios undergo continuous calculation, offering deep insight into the quality of returns. These metrics ensure selected assets not only perform well but do so with favorable risk characteristics.
Market Regime Analysis
The system maintains constant awareness of broader market conditions through analysis of total cryptocurrency market capitalization (TOTAL). This crucial overlay determines whether market conditions warrant active positions or defensive positioning. When market trends or valuations deteriorate beyond critical thresholds, the system enters a protective cash state, preserving capital during adverse conditions.
Scoring Integration
The comprehensive scoring mechanism integrates all analyzed factors into a unified ranking system. Assets must demonstrate strength across multiple categories to qualify for selection, ensuring well-rounded technical characteristics rather than isolated metric strength.
Position Selection & Management
Final asset selection emerges from a rigorous evaluation process where candidates must:
- Rank highly in the relative strength matrix
- Display favorable alpha and beta metrics
- Maintain strong momentum characteristics
- Demonstrate superior risk-adjusted returns
- Pass the GunzoTrendSniper criteria
- Meet minimum threshold requirements across all metrics
Performance Analytics
The sophisticated dashboard provides real-time performance tracking, comparing strategy results against traditional buy-and-hold approaches. This includes:
- Risk-adjusted return metrics
- Maximum drawdown analysis
- Comparative performance ratios
- Real-time equity curves
- Current system state indication
- Active position monitoring
Timeframe Flexibility
While optimized for daily analysis, the system's mathematical framework adapts seamlessly across timeframes. The core logic maintains effectiveness whether deployed for intraday trading or longer-term position management.
Professional Applications
This system serves multiple roles in professional trading environments:
- Portfolio managers seeking systematic rotation strategies
- Risk managers requiring market state evaluation
- Quantitative analysts conducting relative strength assessment
- Long-term investors pursuing systematic exposure
- Active traders requiring comprehensive market analysis
Financial Advisor Disclaimer
This indicator is for informational and educational purposes only and should not be considered financial advice or a recommendation to buy, sell, or hold any investment or security. The creator is not a registered investment advisor. Trading and investing in financial markets carries significant risk, including the potential loss of principal. Past performance does not indicate future results. Users must conduct their own due diligence and consult with licensed financial advisors, accountants, or attorneys for professional advice regarding their specific situation before making any investment decisions. The user assumes all responsibility and liability for their trading and investment decisions.
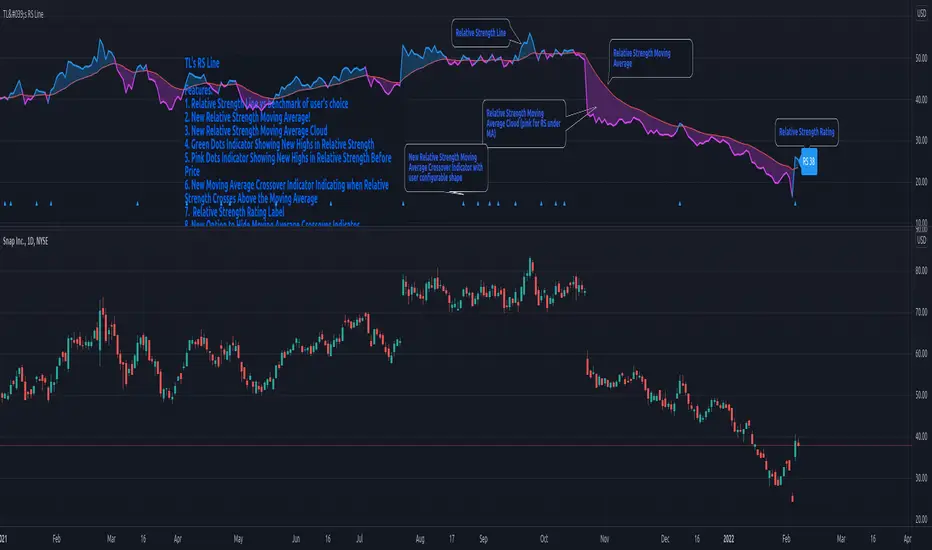
TraderLion's Relative Strength LineRelative Strength Line
Introduction
The script adds a line/candlestick to your charts that shows how well a stock is acting relative to the Index. We call this Relative Strength Line.
Relative Strength ( RS ) separates leading stocks from laggards. Stocks showing RS during a market correction phase will often be the strongest movers once the general market is ready to cooperate.
Instructions on How To Add this Script to Your TradingView Charting Platform
Step 0: Head over to www.tradingview.com
Step 1: Add “TraderLion's Relative Strength Line” to your Favorites by clicking “Add to Favorite Scripts” near the bottom of the page.
Step 2: Click “Indicators” at the very top on TradingView. Under Favorites click “Relative Strength Line”
Step 3: Hover on the Indicator name ( Relative Strength Line) on your plot under legend and click the three dots at the very right. Under the “Pin To Scale” choose a setting that works best for you (optional).
Step 4: Done. You have now plotted the Relative Strength Line
Features
1) The Pink Dot symbolizes the RS Line reaching new highs before price. RS New Highs Before Price (RSNHBP) is often indicative of a break out emerging.
2) Direction-Based Relative Strength. The RS Line can be customized to color coat depending on its most recent direction. When the line moves up it will be blue, and on the way down pink. Easily glance and see phases of relative strength on the chart.
3) Raw RS Rating - The RS Line Script features an RS Rating from 1-99 with 99 being the strongest rating. The measures the stock’s performance relative to the Index you input.
3) Custom Index Input under Settings - requested feature!
4) Candlestick Relative Strength - A different unique way to view the Relative Strength Line
5) Alerts Conditions - Relative Strength New Highs and Relative Strength New Highs Before Price (RSNHBP)
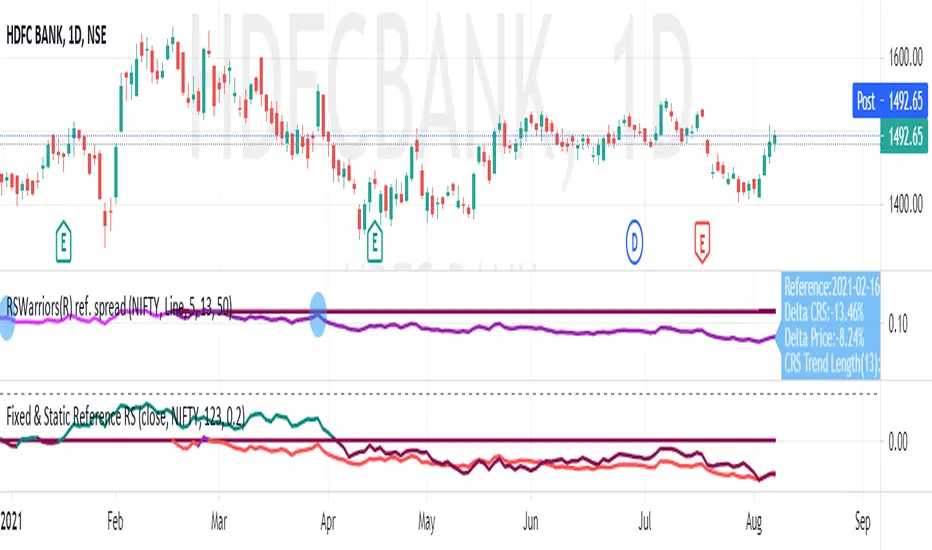
Fixed Reference Relative StrengthRelative Strength based on a fixed reference session date. This study works on day timeframe only.
The idea here is to "fix" a reference trading session day. The relative strength of subsequent candles are measured based on this reference day only. Relative strengths of bars before this bar is irrelevant and not plotted. As the plotting of the bars advances, the length is automatically adjusted so that the base reference is the "fixed" reference only. The RS value is multiplied by 100 to give a percentage value.
The other Relative Strength indicators that I have published (and other Relative Strength scripts generally available on TradingView), generally take a fixed length as input and that has to be advanced each trading session. What this results into is that only the "latest bar" RS is compared to the "reference" session date. All the RS values prior to this latest bar is actually compared to days previous to the reference date.
In the example above, we have input 13-Feb-2020 as the "fixed" reference trading session day. Starting from 14-Feb-2020, each session day, we calculate the RS always with respect to 13-Feb-2020, unlike the other scripts. When the RS value of today, 08-Sep-2020 is being calculated, it is using 13-Feb-2020 (as the other scripts do when the length is advanced one day each trading session day). However, when the RS value of 07-Sep-2020 is being calculated today (08-Sep-2020), it is still using 13-Feb-2020 as the reference. In the other scripts, a calculation of RS for 07-Sep-2020 on 08-Sep-2020 would have taken 12-Feb-2020 as the reference value.
This plot thus gives the exact performance of the script with respect to the benchmark index from the fixed reference each day. A performance trend is therefore possible to do on this plot.
Relative Strength Buy/Sell SignalsThis Pine Script builds on the MarketSurge-style Relative Strength indicator. It calculates the RS line by comparing the stock's close to a benchmark (default: SPY). Buy signals are generated when the RS line crosses above its moving average (default 10-period SMA), indicating improving relative strength. Sell signals occur when it crosses below, suggesting weakening relative strength. Signals are labeled "BUY" (green) and "SELL" (red) on the chart, with background highlights.
It also retains the new 52-week RS highs (orange circles) and lows (purple circles), which can serve as additional confirmation for outperformance or underperformance.
Note: This approximates relative strength for trading signals but does not replicate the proprietary IBD RS Rating (a 1-99 percentile rank across all stocks). For best results, use on daily charts and combine with other analysis. Backtest thoroughly, as no strategy guarantees profits

Relative Strength according to Oster (RSO)Overview:
Relative Strength according to Oster (RSO) is an innovative tool that redefines how traders assess an asset's market strength. Moving beyond traditional indicators, RSO offers a sophisticated and highly responsive measure of an asset's potential to continue performing well. By integrating groundbreaking methodologies, RSO equips traders with unparalleled insights into market dynamics, making it an essential tool for anyone looking to stay ahead in today's fast-paced trading environment.
Understanding RSL (Relative Strength according to Levy):
At its core, Relative Strength according to Levy (RSL) is a powerful concept rooted in the idea that an asset currently exhibiting strength is more likely to maintain or even enhance that strength in the future. RSL calculates this by comparing an asset's current price to its moving average, providing a clear picture of its relative performance over time. The further its value is above 1, the higher the market momentum and vice versa. This relationship to the moving average is crucial, as it indicates not just where the asset stands today but also its trajectory in the context of historical performance. The ability to identify assets that consistently outperform is a game-changer for traders, and RSL has long been a cornerstone in this pursuit.
RSO vs. Traditional RSL: A Leap Forward
The RSO takes the traditional RSL concept and propels it into new territory with its innovative correlation-based approach. This is where RSO truly shines, offering a unique and sophisticated analysis that goes far beyond the basics.
Why RSO is Revolutionary:
Correlation Adjustment: The RSO doesn’t just measure an asset’s strength in isolation. Instead, it adjusts its readings based on how closely the asset's price movements correlate with a chosen benchmark. This groundbreaking feature ensures that the RSO is not just reactive to past performance but also predictive of how the asset might behave relative to the broader market, adding a layer of precision that is unparalleled in traditional strength indicators.
Superior Strength Option: With the RSO, traders have the option to include superior strength factors, adding another dimension of insight. This feature allows for more stable and reliable long-term signals. On the flip side, those who prefer a more dynamic trading style can opt to exclude this factor for more frequent, shorter-term signals. This level of customization is rare and sets the RSO apart as a truly adaptable tool.
Enhanced Market Insights: RSO’s correlation-based approach doesn’t just show how strong an asset is—it reveals how that strength is likely to develop in relation to the benchmark's underlying trends. This isn’t merely about comparing performance; it’s about understanding the asset’s potential trajectory in a much broader market context. Such insight is invaluable for making informed, strategic trading decisions.
Practical Application:
The RSO isn’t just innovative in theory; it’s designed for practical, real-world trading. Traders can set customized alerts based on RSO’s readings, ensuring they’re always aware of key buy or sell signals as they occur. The flexibility to include or exclude superior strength factors means that RSO can be tailored to fit any trading style, whether focused on long-term investments or short-term opportunities.
Conclusion:
In conclusion, the Relative Strength according to Oster (RSO) is more than just an indicator; it’s a breakthrough in market analysis. By integrating correlation adjustments and offering unparalleled customization options, RSO provides traders with insights that are both deeper and more actionable than ever before. This innovative tool is designed to empower traders, giving them the edge they need to succeed in an increasingly complex market landscape. Whether you’re a seasoned trader or just starting out, the RSO is a must-have tool for navigating market trends with confidence and precision.

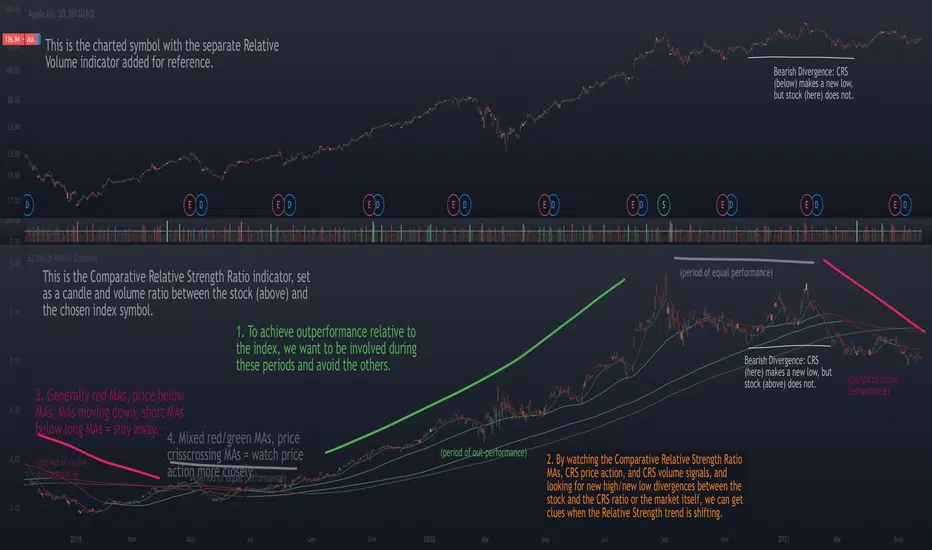
Relative Strength Ratio Chart + Relative Volume Gradient CandlesThe purpose of the Comparative Relative Strength Ratio indicator is to provide a way of looking at a relative strength ratio as a candle graph instead of only a closing price line, as well as to provide relative volume gradient coloration on the ratio-generated candles, and additionally to plot moving averages of the CRS ratio that can help display shifting trends in relative strength.
This is different from my Relative Volume Gradient Paintbars indicator, as well as my Comparison Chart with Relative Volume Gradient Paintbars indicator, in that the first looks at the charted symbol itself, the second looks at an alternate symbol, and this third indicator looks at a ratio between the charted symbol and the alternate symbol.
The idea behind this indicator is to provide additional means of evaluating relative strength, such as comparing the moving averages of the comparative relative strength ratio graph to the charted stock symbol's own MAs in order to gauge strength, comparing the price action of the ratio to that of the individual stock and its index, and comparing the volume gradient signal between the ratio, the stock, and the index.
The unique volume features allow comparing volume as a percent of the index volume, as well as stock's candle range as a percent of the range of the index. So when the volume as a percentage of the index's overall volume becomes high, this can be made to highlight the candles.
Relative StrengthA relative strength overlay, similar to that of IBD shown on Marketsmith.
The value is not from 0-100, it is compared with the Nasdaq x2 ETF, QLD. Therefore, if greater than zero it will give you a good indication that the stock has a very good relative strength.
Feel free to change the comparison ETF to one of your choosing.
